TL;DR
We simulated existing positions across Creators, Stakers, and Promoters: over 95% will earn more each month under V1.1 than under the current economy. The new 4:1 pATTN to ATTN ratio is fully balanced by 100% unlocked profits — what you earn, you can withdraw. No ranking system, no locked portions. Simpler, fairer, and built to attract more stakers and more external liquidity — which benefits everyone already in the system.The Long Version
When we launched the ATTN economy, we were trying to solve something that sounds simple but isn’t: how do you let people decide what matters — without a platform deciding for them? The first version established the mechanisms that make this possible — the bonding curve, the creator fee, the staking signal. A lot of it worked. But running a live economy teaches you things no whitepaper can. After watching it in action, listening carefully to the community, and being honest about what we understood better now, we evolved it. This is Economy V1.1. The bones are the same. The tuning is better. The core insight driving this iteration: staking is a signal of belief, not a bet against other people. The economy should be a positive-sum game — where your gain doesn’t come at someone else’s expense, but from the real attention and external value that flows into the system. It’s an opportunity-gain model, not a zero-sum one. V1.1 is built around that principle more completely than V1.0 was.What We Learned From V1.0
V1.0 was a bold first step. It established the primitives that hold up — and still do. But three things became clearer over time. Staking felt riskier than it needed to be. When you staked 1,000 pATTN, only 700 backed your position. 250 went to the revenue pool, 50 to the creator. You started 30% underwater. For early adopters willing to explore, that was fine. For the broader community we want to reach, it created unnecessary friction. Staking should feel like conviction, not risk capital. The revenue pool was internally funded. In V1, stakers funded each other’s rewards. That works in a growing system with constant new entrants. But it creates a structural dependency — someone always has to come after you for the math to work. Revenue should come from outside the system — from advertisers, licensors, and the broader attention economy — not from redistributing what stakers put in. The math was hard to follow. The pATTN to ATTN ratio was 1:1, but 95% of balances were locked. The withdrawal system depended on rank, constructiveness scores, and different percentages for different earning types. Technically sound. But if the community can’t understand when and how they can access their own earnings, that’s on us to fix. V1.1 addresses all three. Here’s how.What Changed
1. Your Stake Is Now 99% Protected
You stake 100 pATTN. 99 stays yours. 1 goes to the creator. That’s it.The revenue pool no longer takes a cut from stakers. Staking is a signal of belief in a memory. The economics should match that.
| V1.0 | V1.1 | |
|---|---|---|
| Principal (yours) | 70% | 99% |
| Revenue pool | 25% | 0% |
| Creator fee | 5% | 1% |
2. Revenue Comes From Injections, Not From Other Stakers
In V1.1, the revenue pool is funded by injections — value entering the system from outside. The platform regularly injects between 2.5% and 7.5% of total stakes into the memory ecosystem. As the economy grows, advertisers and licensors take over a larger share of that role, paying to associate with high-attention memories.| V1.0 | V1.1 | |
|---|---|---|
| Revenue pool funded by | Other stakers and Injections | Only Injections |
| Creator fee from injections | 5% | 10% |
| Platform injection rate | 2.5%–7.5% of stakes | 2.5%–7.5% of stakes |
3. Creators Keep Everything They Earn
No monthly caps. No withdrawal limits on earnings. If your memory earned it, it’s yours.Fully, without formulas.
| V1.0 | V1.1 | |
|---|---|---|
| Creator fee from stakes | 5% | 1% |
| Creator fee from injections | 5% | 10% |
| Monthly withdrawal limit | 5% of earnings | 100% — no limits |
4. Promoters: From 10% to 30%
The promoter cut — paid by the platform, not deducted from creators or stakers — grows from 10% to 30% of creator earnings. The people who grow the network should meaningfully share in what it produces.| V1.0 | V1.1 | |
|---|---|---|
| Promoter cut | 10% of creator earnings | 30% of creator earnings |
| Paid by | Platform | Platform |
| Withdrawal limit | Rank-based cap | No cap |
5. A New pATTN to ATTN Ratio: 4:1 — and Full Transparency
In V1.0, the ratio was 1:1 — but 95% of pATTN was locked. So 1,000 pATTN in your balance meant roughly 50 ATTN accessible. The number looked large. The reality was much smaller. In V1.1, the ratio is 4:1 — but 100% of earned pATTN is withdrawable. So 1,000 earned pATTN means 250 ATTN accessible.| V1.0 | V1.1 | |
|---|---|---|
| Conversion ratio | 1 pATTN = 1 ATTN | 4 pATTN = 1 ATTN |
| Withdrawal lock | 95% locked | 0% locked (on earned pATTN) |
| 1,000 earned pATTN → accessible ATTN | ~50 ATTN | 250 ATTN |
6. A New Off-Ramp Fee — Rewarding Long-Term Conviction
We’re introducing a time-based fee on redemptions.The longer you hold your stake, the lower your exit cost. (Off-ramp fees may be updated over time. Please stay informed through app and community updates).
| Holding period | Off-ramp fee |
|---|---|
| Day 1 | 2.5% |
| Day 2 | 1% |
| Day 3 | 0.5% |
| After that | 0.25% |
7. One Simple Withdrawal Rule
Old system: rank tiers, constructiveness factors, different percentages for different earning types. New system: If you earned it or bought it, it’s yours. If you received it for free, it stays in the system. Airdrops, registration bonuses, daily rewards — these are designed to help you participate, not to be immediately converted. Everything earned through creating, staking, or promoting is withdrawable once every 30 days. No formulas. No rank calculations. One rule.Full Comparison: V1.0 vs V1.1
| V1.0 | V1.1 | |
|---|---|---|
| Stake protection | 70% | 99% |
| Revenue pool funded by | Other stakers (25% of each stake) | Injections (90% of each injection) |
| Creator fee from stakes | 5% | 1% |
| Creator fee from injections | 5% | 10% |
| Creator withdrawal limit | 5% of earnings per month | 100% — no limits |
| Promoter cut | 10% of creator earnings | 30% of creator earnings |
| Promoter withdrawal limit | Rank-based cap | 100% — no limits |
| pATTN to ATTN ratio | 1:1 (95% locked) | 4:1 (100% of earned unlocked) |
| Off-ramp fee | None | 5% → 2.5% → 0.5% (time-based) |
| Fee revenue destination | N/A | Reinjected into top TVL memories |
| Withdrawal rule | Rank-based, multi-factor | Earned/bought = yours. Free = restricted |
| Bonding curve | Same | Same |
| Platform injection rate | — | 2.5%–7.5% of stakes |
The Bonding Curve: How Early Stakers Earn More
The bonding curve hasn’t changed. It’s one of the core mechanics that makes this economy work — and it’s worth understanding clearly.The Formula
- P(v) is the price per belief token at a given TVL
- 0.10 is the floor price — every memory starts here
- 0.005 is the curve coefficient
- v is the current TVL (principal + revenue reserves)
- 0.6 is the sublinear exponent — the key to everything
Price Behavior
| TVL (pATTN) | Price per token |
|---|---|
| 0 | 0.10 pATTN |
| 1,000 | 0.42 pATTN |
| 5,000 | 0.93 pATTN |
| 10,000 | 1.36 pATTN |
| 20,000 | 2.00 pATTN |
| 30,000 | 2.53 pATTN |
| 50,000 | 3.40 pATTN |
| 100,000 | 5.10 pATTN |
| 250,000 | 8.76 pATTN |
What the Sublinear Exponent Means
Because β = 0.6 (less than 1), price grows slower than TVL. Each new stake buys fewer tokens than the one before it. This means:- Early stakers get more tokens per pATTN — their ownership share is larger
- Late stakers get fewer tokens — their ownership share is smaller
- When injections arrive, they’re distributed proportionally to token ownership — so early stakers receive more
Bonding Curve Simulation: Three Stakers, One Injection
Three users each stake 10,000 pATTN into the same memory, one after another. Then a 100,000 pATTN injection arrives. Same stake. Very different outcomes. Token Minting| User 1 (first) | User 2 (second) | User 3 (third) | |
|---|---|---|---|
| TVL range when staking | 0 → 10,000 | 10,000 → 20,000 | 20,000 → 30,000 |
| Avg price per token | 0.71 pATTN | 1.67 pATTN | 2.26 pATTN |
| Tokens minted | 14,155 | 5,976 | 4,420 |
| Ownership share | 57.7% | 24.3% | 18.0% |
| User 1 | User 2 | User 3 | |
|---|---|---|---|
| Ownership share | 57.7% | 24.3% | 18.0% |
| Injection share | 51,890 pATTN | 21,907 pATTN | 16,203 pATTN |
| Principal | 9,900 pATTN | 9,900 pATTN | 9,900 pATTN |
| Total position | 61,790 pATTN | 31,807 pATTN | 26,103 pATTN |
| Net profit | +51,790 pATTN | +21,807 pATTN | +16,103 pATTN |
Three Simulations: V1.0 vs V1.1
Same memory across all three roles. A protest in Milan, captured by a local creator. The memory accumulates 250,000 pATTN total TVL. Platform injection: 7.5% of TVL = 18,750 pATTN total. For the staker simulation, we use a mid-stage staker — someone who discovers the memory after it has already gained traction, entering at TVL = 80,000 pATTN. This is the realistic case for most participants: not the first in, not the last. As the chart above shows, in V1.0 this staker is already past the breakeven point. In V1.1, they’re still in profit. At entry TVL of 80,000, the staker’s token ownership is 3.33% of the memory — reflecting the higher token price they paid relative to early entrants.Simulation 1: The Staker
V1.0- Principal protected: 7,000 pATTN (70%)
- Entry cost: −3,000 pATTN
- Revenue pool share (3.33% of 62,500 pATTN): +2,079 pATTN
- Final position: 9,079 pATTN
- Net P&L: −921 pATTN (−9.2%)
- Principal protected: 9,900 pATTN (99%)
- Entry cost: −100 pATTN
- Injection revenue share (3.33% of 16,875 pATTN): +562 pATTN
- Final position: 10,462 pATTN
- Net P&L: +462 pATTN (+4.6%)
| V1 | V1.1 | |
|---|---|---|
| Principal protected | 7,000 pATTN | 9,900 pATTN |
| Entry cost | −3,000 pATTN | −100 pATTN |
| Revenue source | Other stakers and injections | External injections |
| Staker ownership | 3.33% | 3.33% |
| Revenue returned | 2,079 pATTN | 562 pATTN |
| Final position | 9,079 pATTN | 10,409 pATTN |
| Net P&L | −921 pATTN (−9.2%) | +409 pATTN (+4.1%) |
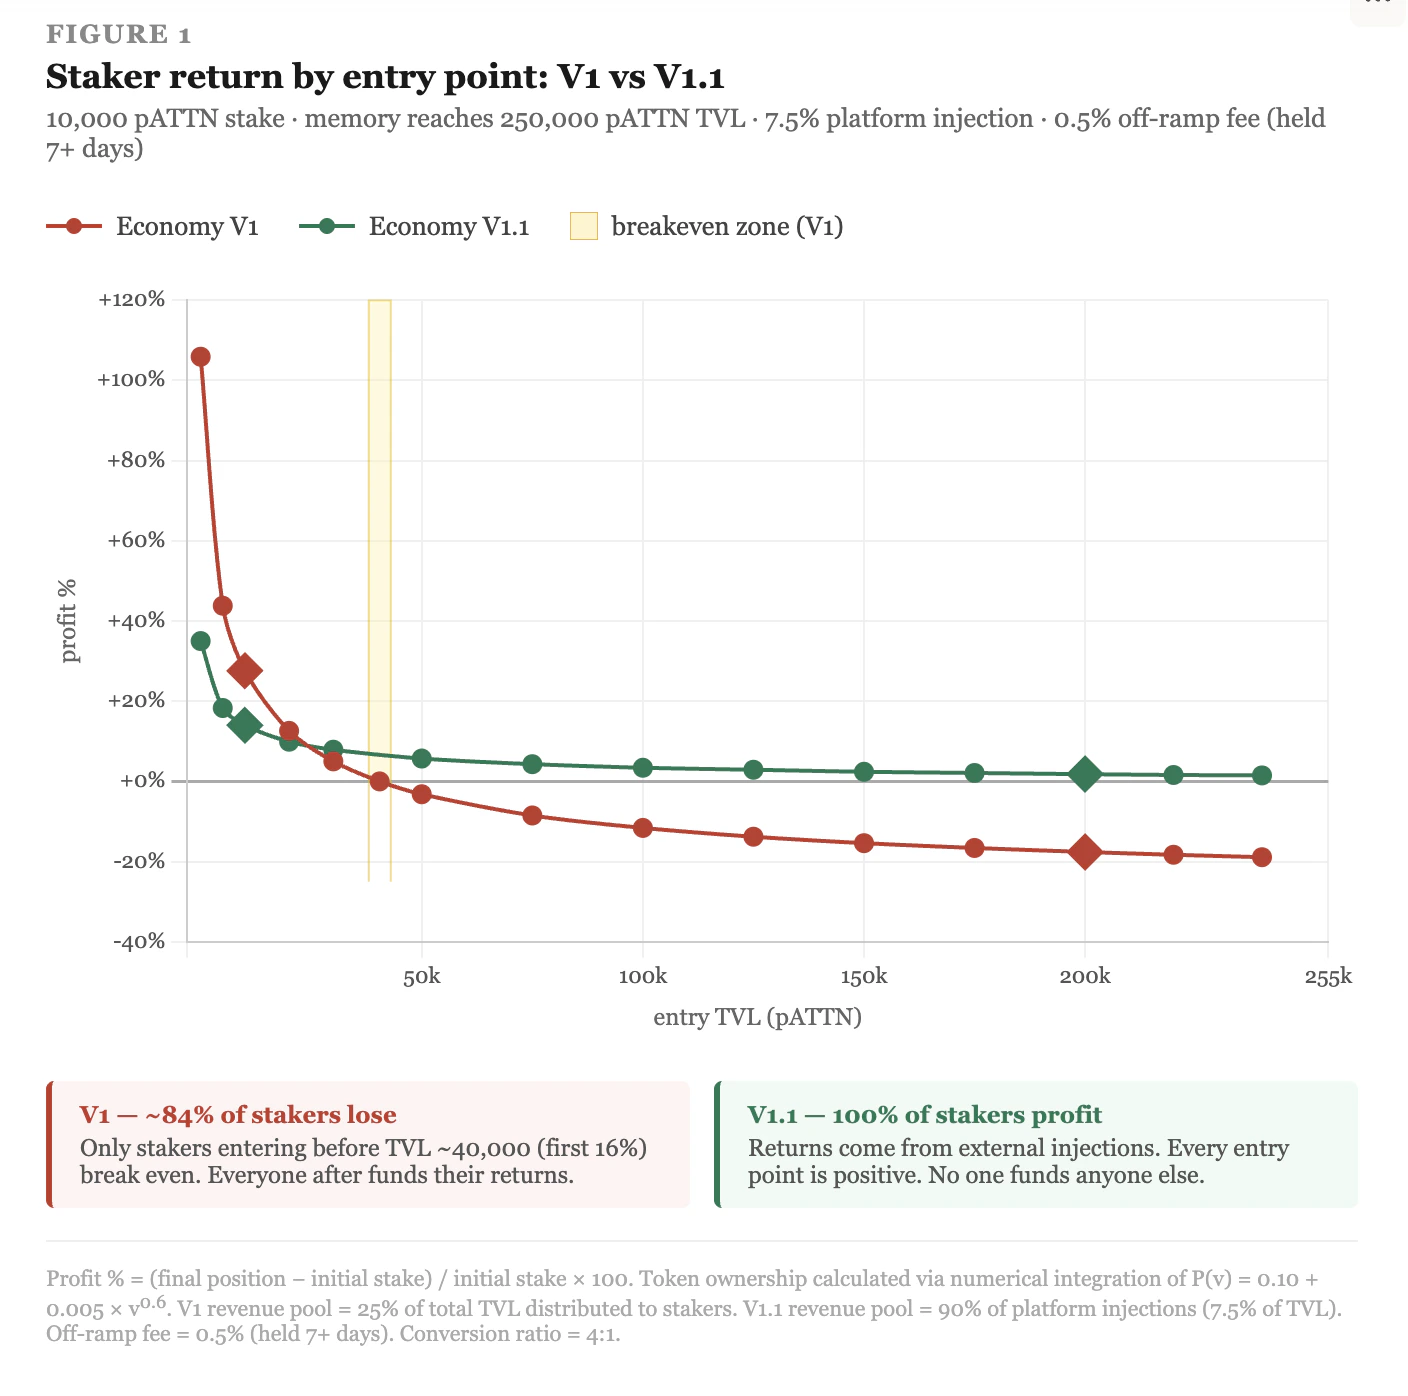
In V1.0, a mid-stage staker on a memory that reached 250,000 TVL still loses money. Their revenue share is too small to recover the 30% entry cost — because by the time they staked, too many tokens had already been minted ahead of them. In V1.1, the same staker is in profit. The entry cost is 1%, and the revenue comes from outside. Under V1.0 mechanics, approximately 84% of all stakers exit at a loss — only those who entered in the first 16% of TVL growth break even. V1.1 inverts that: every staker profits, regardless of when they joined.
Simulation 2: The Creator
V1.0- From stakes (5% of 250,000): 12,500 pATTN
- From injections (5% of 18,750): 938 pATTN
- Total earned: 13,438 pATTN
- Withdrawable this month (5% cap): 672 pATTN = 672 ATTN
- From stakes (1% of 250,000): 2,500 pATTN
- From injections (10% of 18,750): 1,875 pATTN
- Total earned: 4,375 pATTN — all withdrawable immediately
- Withdrawable ATTN (4:1): 1,094 ATTN
| V1.0 | V1.1 | |
|---|---|---|
| From stakes | 12,500 pATTN | 2,500 pATTN |
| From injections | 938 pATTN | 1,875 pATTN |
| Total earned | 13,438 pATTN | 4,375 pATTN |
| Withdrawable ATTN this month | 672 ATTN | 1,094 ATTN |
Simulation 3: The Promoter
Marco brought Sarah (the creator above) to the platform. The promoter cut is paid by the platform — not deducted from creators or stakers. V1.0- Sarah earned 13,438 pATTN
- Marco earns 10% = 1,344 pATTN
- Rank-based withdrawal (~5%): **~67 pATTN **
- Locked: ~1,277 pATTN
- Sarah earned 4,375 pATTN
- Marco earns 30% = 1,312 pATTN — all withdrawable immediately
| V1 | V1.1 | |
|---|---|---|
| Promoter cut | 10% | 30% |
| Promoter earned | 1,344 pATTN | 1,312 pATTN |
| Withdrawable ATTN | ~67 ATTN | 328 ATTN |
| Locked | ~1,277 pATTN | 0 |
Does It Pay to Stake Later?
Short answer: yes —** just less than staking early**. The chart below shows staker profit as a function of entry TVL, for a 10,000 pATTN stake in a memory that reaches 250,000 TVL with 7.5% platform injections.| Entry TVL | Ownership | Profit (pATTN) | Withdrawable ATTN |
|---|---|---|---|
| 0 | 21.74% | +3,568 | 3,375 |
| 5,000 | 11.81% | +1,894 | 2,959 |
| 10,000 | 9.21% | +1,454 | 2,849 |
| 20,000 | 6.81% | +1,049 | 2,749 |
| 30,000 | 5.59% | +844 | 2,698 |
| 50,000 | 4.29% | +625 | 2,643 |
| 75,000 | 3.45% | +482 | 2,607 |
| 100,000 | 2.94% | +396 | 2,586 |
| 150,000 | 2.33% | +294 | 2,561 |
| 200,000 | 1.98% | +234 | 2,546 |
| 240,000 | 1.78% | +200 | 2,537 |
The Pattern Across All Three
In every case, gross pATTN numbers are lower in V1.1. That’s intentional — and it’s honest. The large numbers in V1.0 were mostly locked, mostly dependent on new entrants, and subject to formulas that were hard to follow. V1.1 is smaller numbers that mean something. The staker is in profit without taking from anyone. The creator accesses more real ATTN. The promoter gets nearly 5× more accessible ATTN despite a lower gross number. This is what a positive-sum game looks like in practice. Not everyone winning on paper. Everyone winning on what they can actually use.Why We Did This
We’re not building a trading platform.We’re building infrastructure for how attention and memory get valued in the world. V1.0 asked stakers to take on real risk to signal belief. V1.1 brings that risk down to near zero while keeping the signal meaningful — because the off-ramp fee and the bonding curve still reward long-term conviction over short-term extraction. The direction is clear: an economy where participating feels like an opportunity, not a gamble. Where the value of staking early on something that matters is the upside you gain — not the money you take from whoever comes next. We’ll keep evolving. This is V1.1, not the final version. But the foundation is now closer to what we always intended it to be. Economy V1.1 goes live on March 23rd.
Jonathan, Patrick and Matteo,
Co-founders, Collective Memory